New RTA portal brings all interactive mapping products together in one place
February 24, 2022
February 24, 2022

This is a guest blog post from Hersh Singh, RTA Principal Analyst.
Maps are an integral part of our day-to-day lives. Mapping products are interwoven into many common activities, from morning traffic and weather reports to using navigation apps to find the most efficient route possible for our trips. Nearly every news story seems to have some spatial component—from tracking COVID-19 infections to housing prices and voting results.
Now, a wide array of interactive maps and spatial data relating to our region’s transportation system is available in one location. The RTA created and launched the RTA Mapping and GIS Portal in December 2021. The portal can be accessed from the RTAMS website and is a one-stop shop for all RTA mapping products, including dashboards, story maps, printable system maps, and, for the first time, interactive and downloadable GIS (geographic information system) data providing a foundation for mapping and analysis. The Mapping and GIS Portal brings a wealth of information to the public in accessible, interactive formats, allowing anyone to dive into this data.
Mapping at the RTA has come a long way even in just the past decade. Our mapping work started with hard-copy maps of our transit systems, printed and distributed for the general public and for employee reference. In 2010 the RTA began translating our printed maps to online versions and allowing for simple functions like zooming. And while hosting maps online offered greater access for the public, creating those maps required pricey software licenses and specialized skills, which kept the average person from experimenting with map creation on their own.
Since then, advancements in online mapping have opened doors for anyone with an internet connection to use online tools and easily share their own maps. The Mapping and GIS Portal was created to better manage the numerous mapping products created at the RTA and to share their utility with the public. During this process, the applications were updated with modern, simplified symbology matching our system mapping products. Many of the mapping applications were updated to use the next generation of ArcGIS web mapping apps, known as Instant Apps, to provide users with a modern, intuitive user experience, regardless of formal training in data analysis and mapping.
As you can see when you explore the new portal, mapping at the RTA is extensive, examining subjects like transit-dependent populations, shifts in employment, COVID-19’s impact on transit service, and much more. Mapping is used by various departments because of its data management and efficiency benefits, allowing staff to do their jobs better and communicate their successes in a streamlined way. For instance, story maps allow interactive storytelling elements to present context and share data on a specific topic. The RTA’s Community Planning department uses story maps to aggregate and share out information on individual planning projects throughout the region, such as this recent example using spatial data to show the RTA’s 2020 and 2021 Community Planning projects.
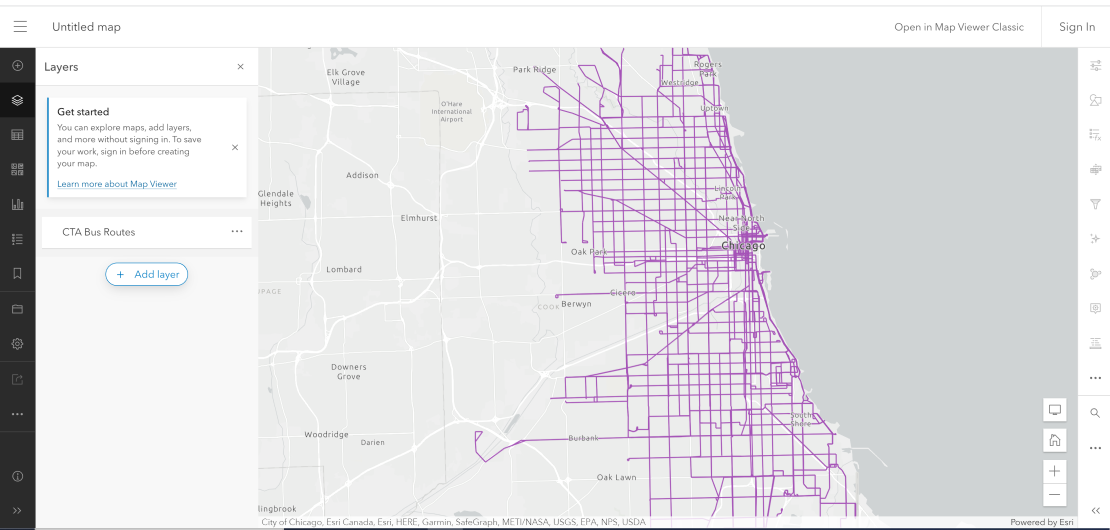
The portal features interactive and downloadable GIS data of the system’s routes, stations, and lines in one easy-to-access to location, allowing anyone with an internet connection to create maps displaying the information most interesting to them. A user completely new to mapping can create their own online map by navigating to the main page of the portal and scrolling down to the “Shapefiles & Feature Layers” section. Simply click on one of the feature layers, and a map will automatically generate, illustrating transit assets like rail lines, stations, and CTA bus routes, which you can see below.

By providing greater access, we hope that more people will interact with the data, create their own maps, and share their analyses, providing more tools for data-driven decision making.
Subscribe to our Newsletter
Related Articles
 CTF Illinois provides transportation and training to empower people with disabilities in the south suburbs
This is part of our Moving You series, which examines federally funded programs managed by the RTA that expand transportation options and access for all. ...
March 30, 2022 Kendall Area Transit provides connections—in more ways than one—for seniors and people with disabilities
This is part of our Moving You blog series, which highlights programs managed by the RTA that expand transportation options and access to transit for all....
March 2, 2022 New RTA portal brings all interactive mapping products together in one place
This is a guest blog post from Hersh Singh, RTA Principal Analyst. Maps are an integral part of our day-to-day lives. Mapping products are interwoven into m...
February 24, 2022 Ride in Kane expands mobility for seniors, people with disabilities, and low-income workers
This is part of our Moving You blog series, which examines federally funded programs managed by the RTA that expand transportation options and access for ...
February 17, 2022