RTA launches performance measures dashboards to track progress on strategic plan outcomes
October 4, 2023
October 4, 2023
The RTA’s regional transit strategic plan, Transit is the Answer, identifies six key outcomes that are needed to achieve the plan’s vision of “safe, reliable, accessible public transportation that connects people to opportunity, advances equity, and combats climate change.” Three of these outcomes describe goals for the transit system: in a state of good repair; financially stable; and safe, accessible, reliable, and useful for riders. And three describe goals for the region: connected, winning the fight against climate change, and thriving.
In order to track progress toward these key outcomes—and to understand how outcomes may vary across communities, by race, by income, or by other important factors—the RTA has launched three Performance Measures Dashboards. The measures capture user experience, progress made in investing-in and maintaining transit infrastructure, and how well RTA and the Service Boards are maximizing use of our shared resources. Learn more about all the performance measures at TransitIsTheAnswer.org.
The first performance measures dashboard explores progress toward our transit system being in a state of good repair, including data on accessible stations, annual capital funding, annual capital expenditures, and miles between major mechanical failures. The metrics on this dashboard reflect whether the condition of the system’s capital assets (i.e., tracks, stations, and vehicles) are sufficient to operate at a full level of performance. Check back often; more metrics will be added to this dashboard in the future.
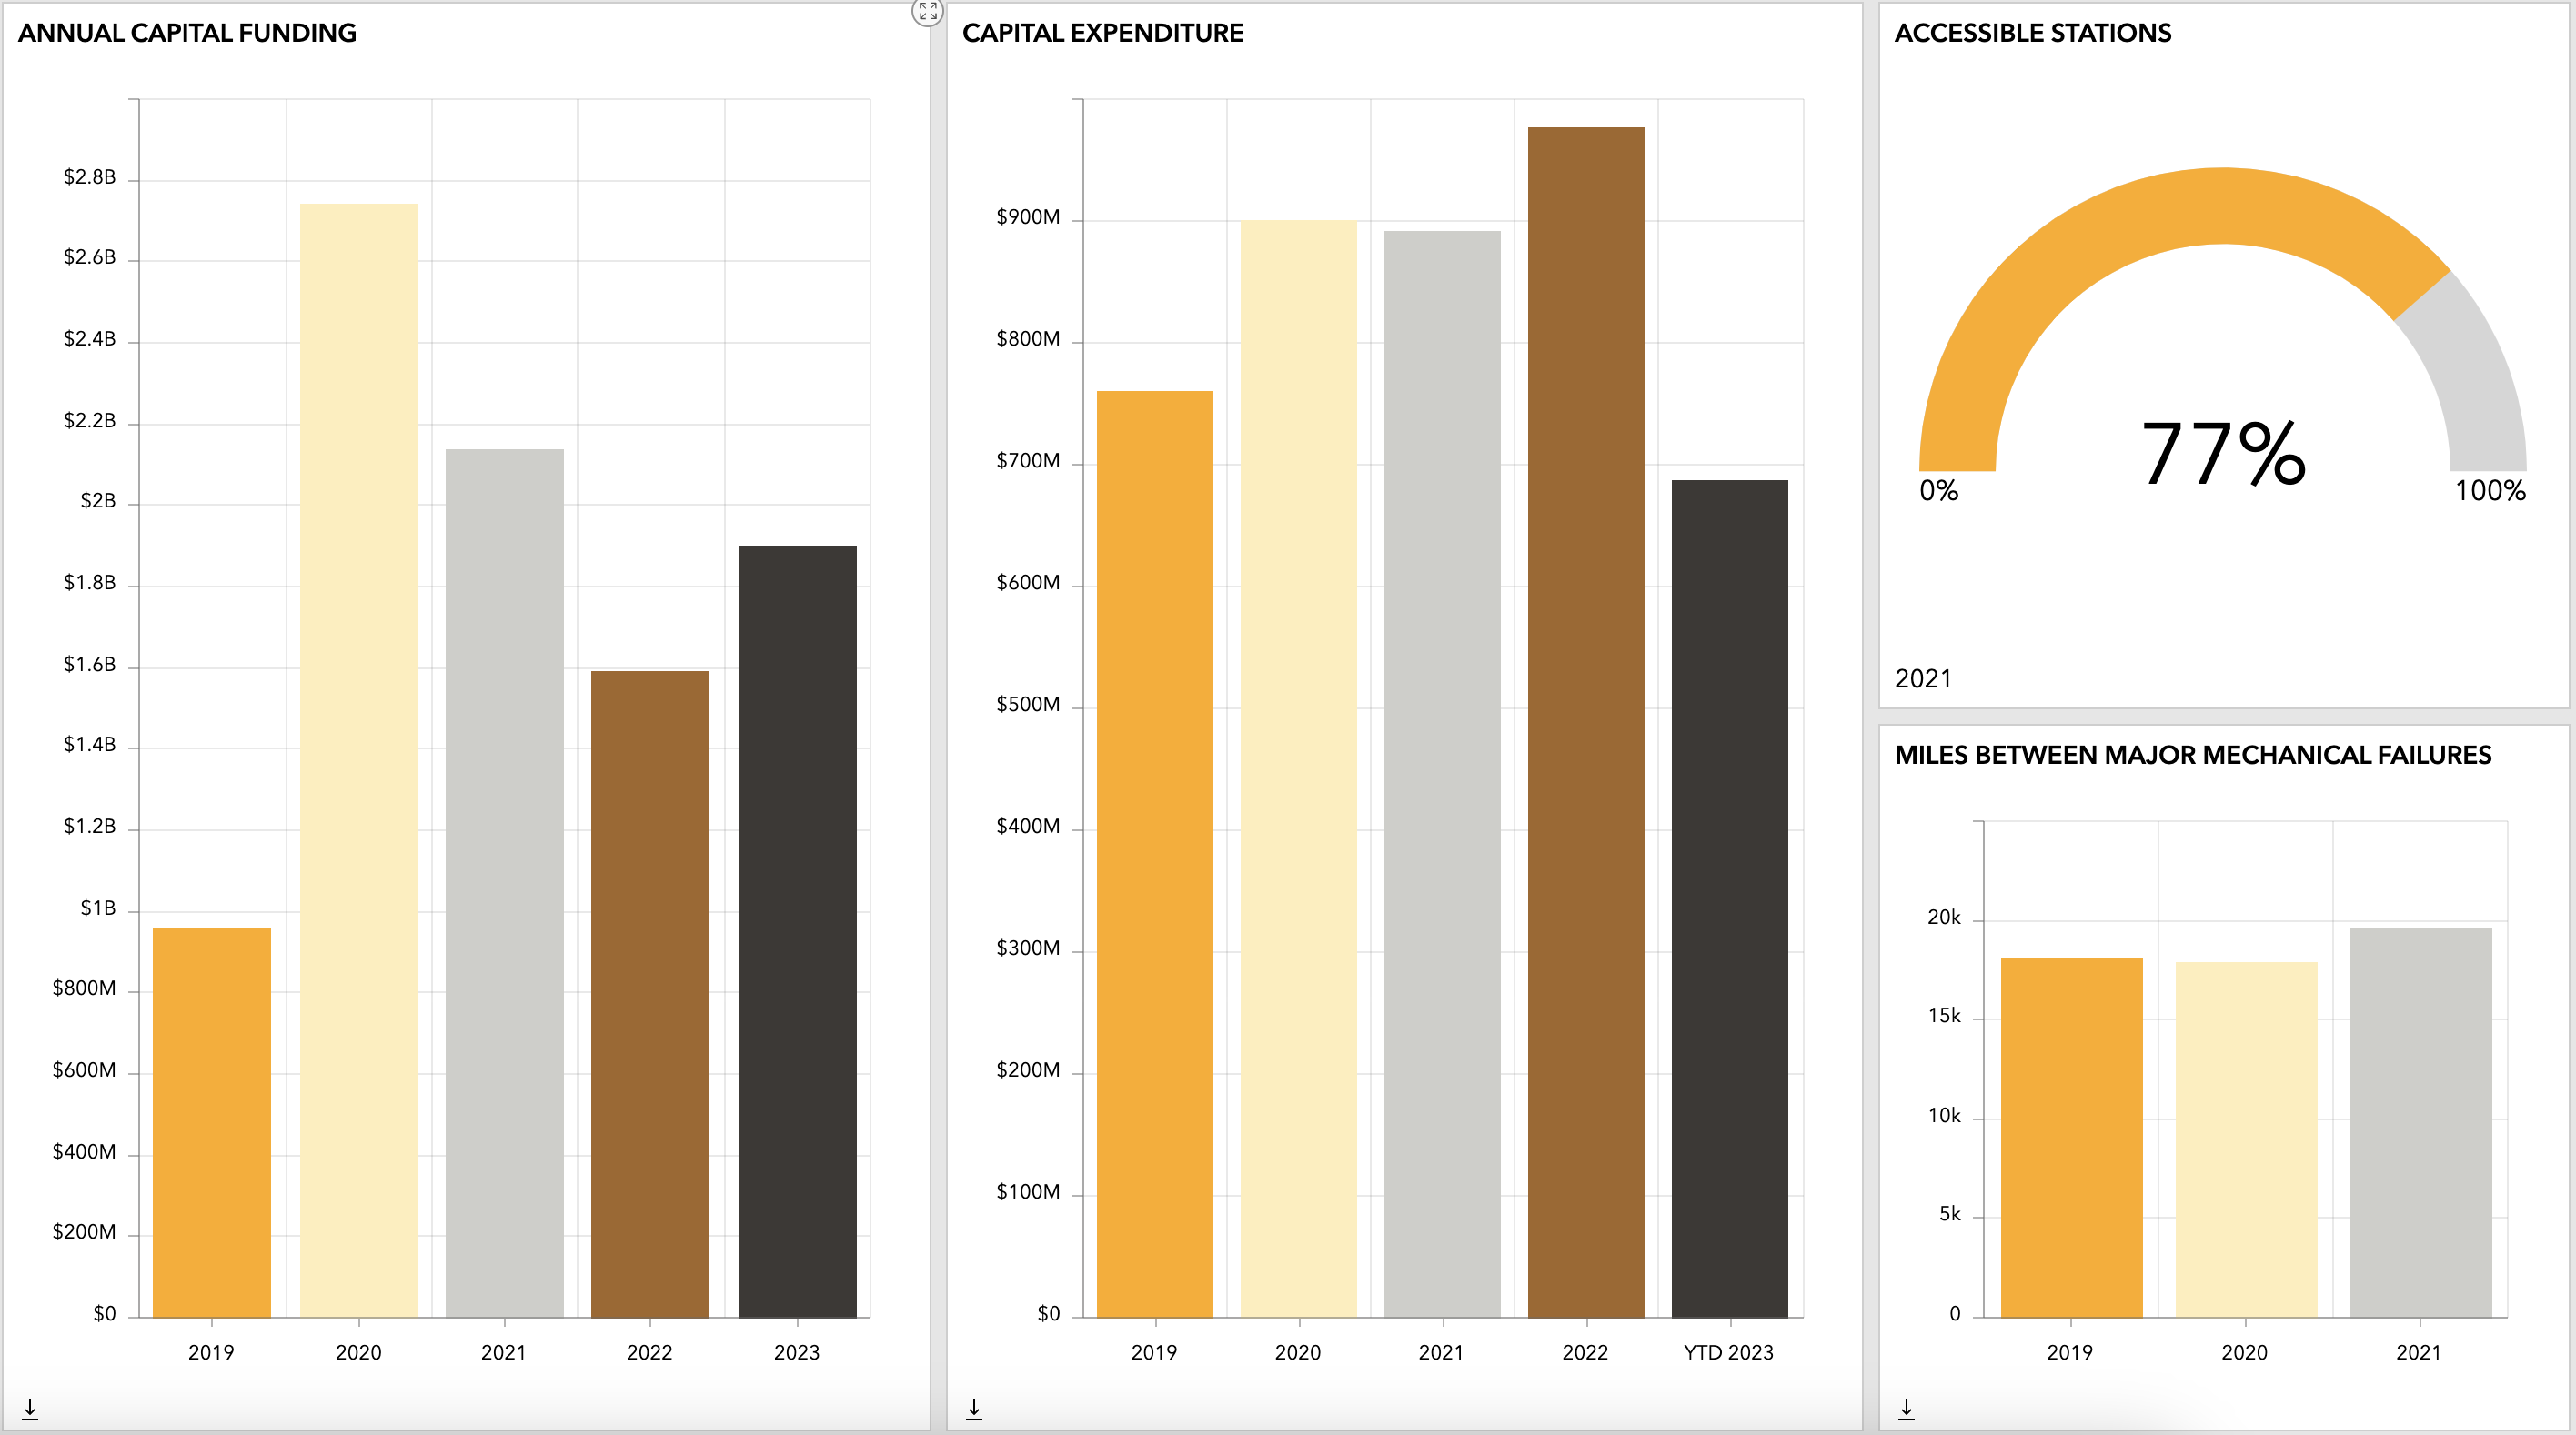
Current metrics on the dashboard include:
ADA-Accessible Stations are passenger facilities which, in compliance with ADA requirements, provide ready access and do not have physical barriers that prohibit and/or restrict access by individuals with disabilities, including individuals who use wheelchairs. The CTA’s All Stations Accessibility Program (ASAP) was launched in 2018 and promises 100 percent of stations being made fully accessible by 2038; the agency is already making progress on this goal, with more than 70% of its stations now fully accessible.
Annual Capital Funding are the amounts budgeted to be expended on capital projects for a given year. Funding allocated in one year is generally expended over a number of subsequent years as projects move through planning, design, and construction phases.
Capital Expenditures are expenses related to the purchase of capital equipment and financing capital projects. Learn more about how capital projects are evaluated in our blog on the topic.
Miles between Major Mechanical Failures are the average number of service miles that transit vehicles travel between failures of some mechanical element that prevents the vehicle from completing a scheduled trip or from starting the next scheduled trip due to limited actual movement or safety concerns.
This dashboard explores progress toward a financially stable transit system. All data are inflation-adjusted and shown over a period of five years.
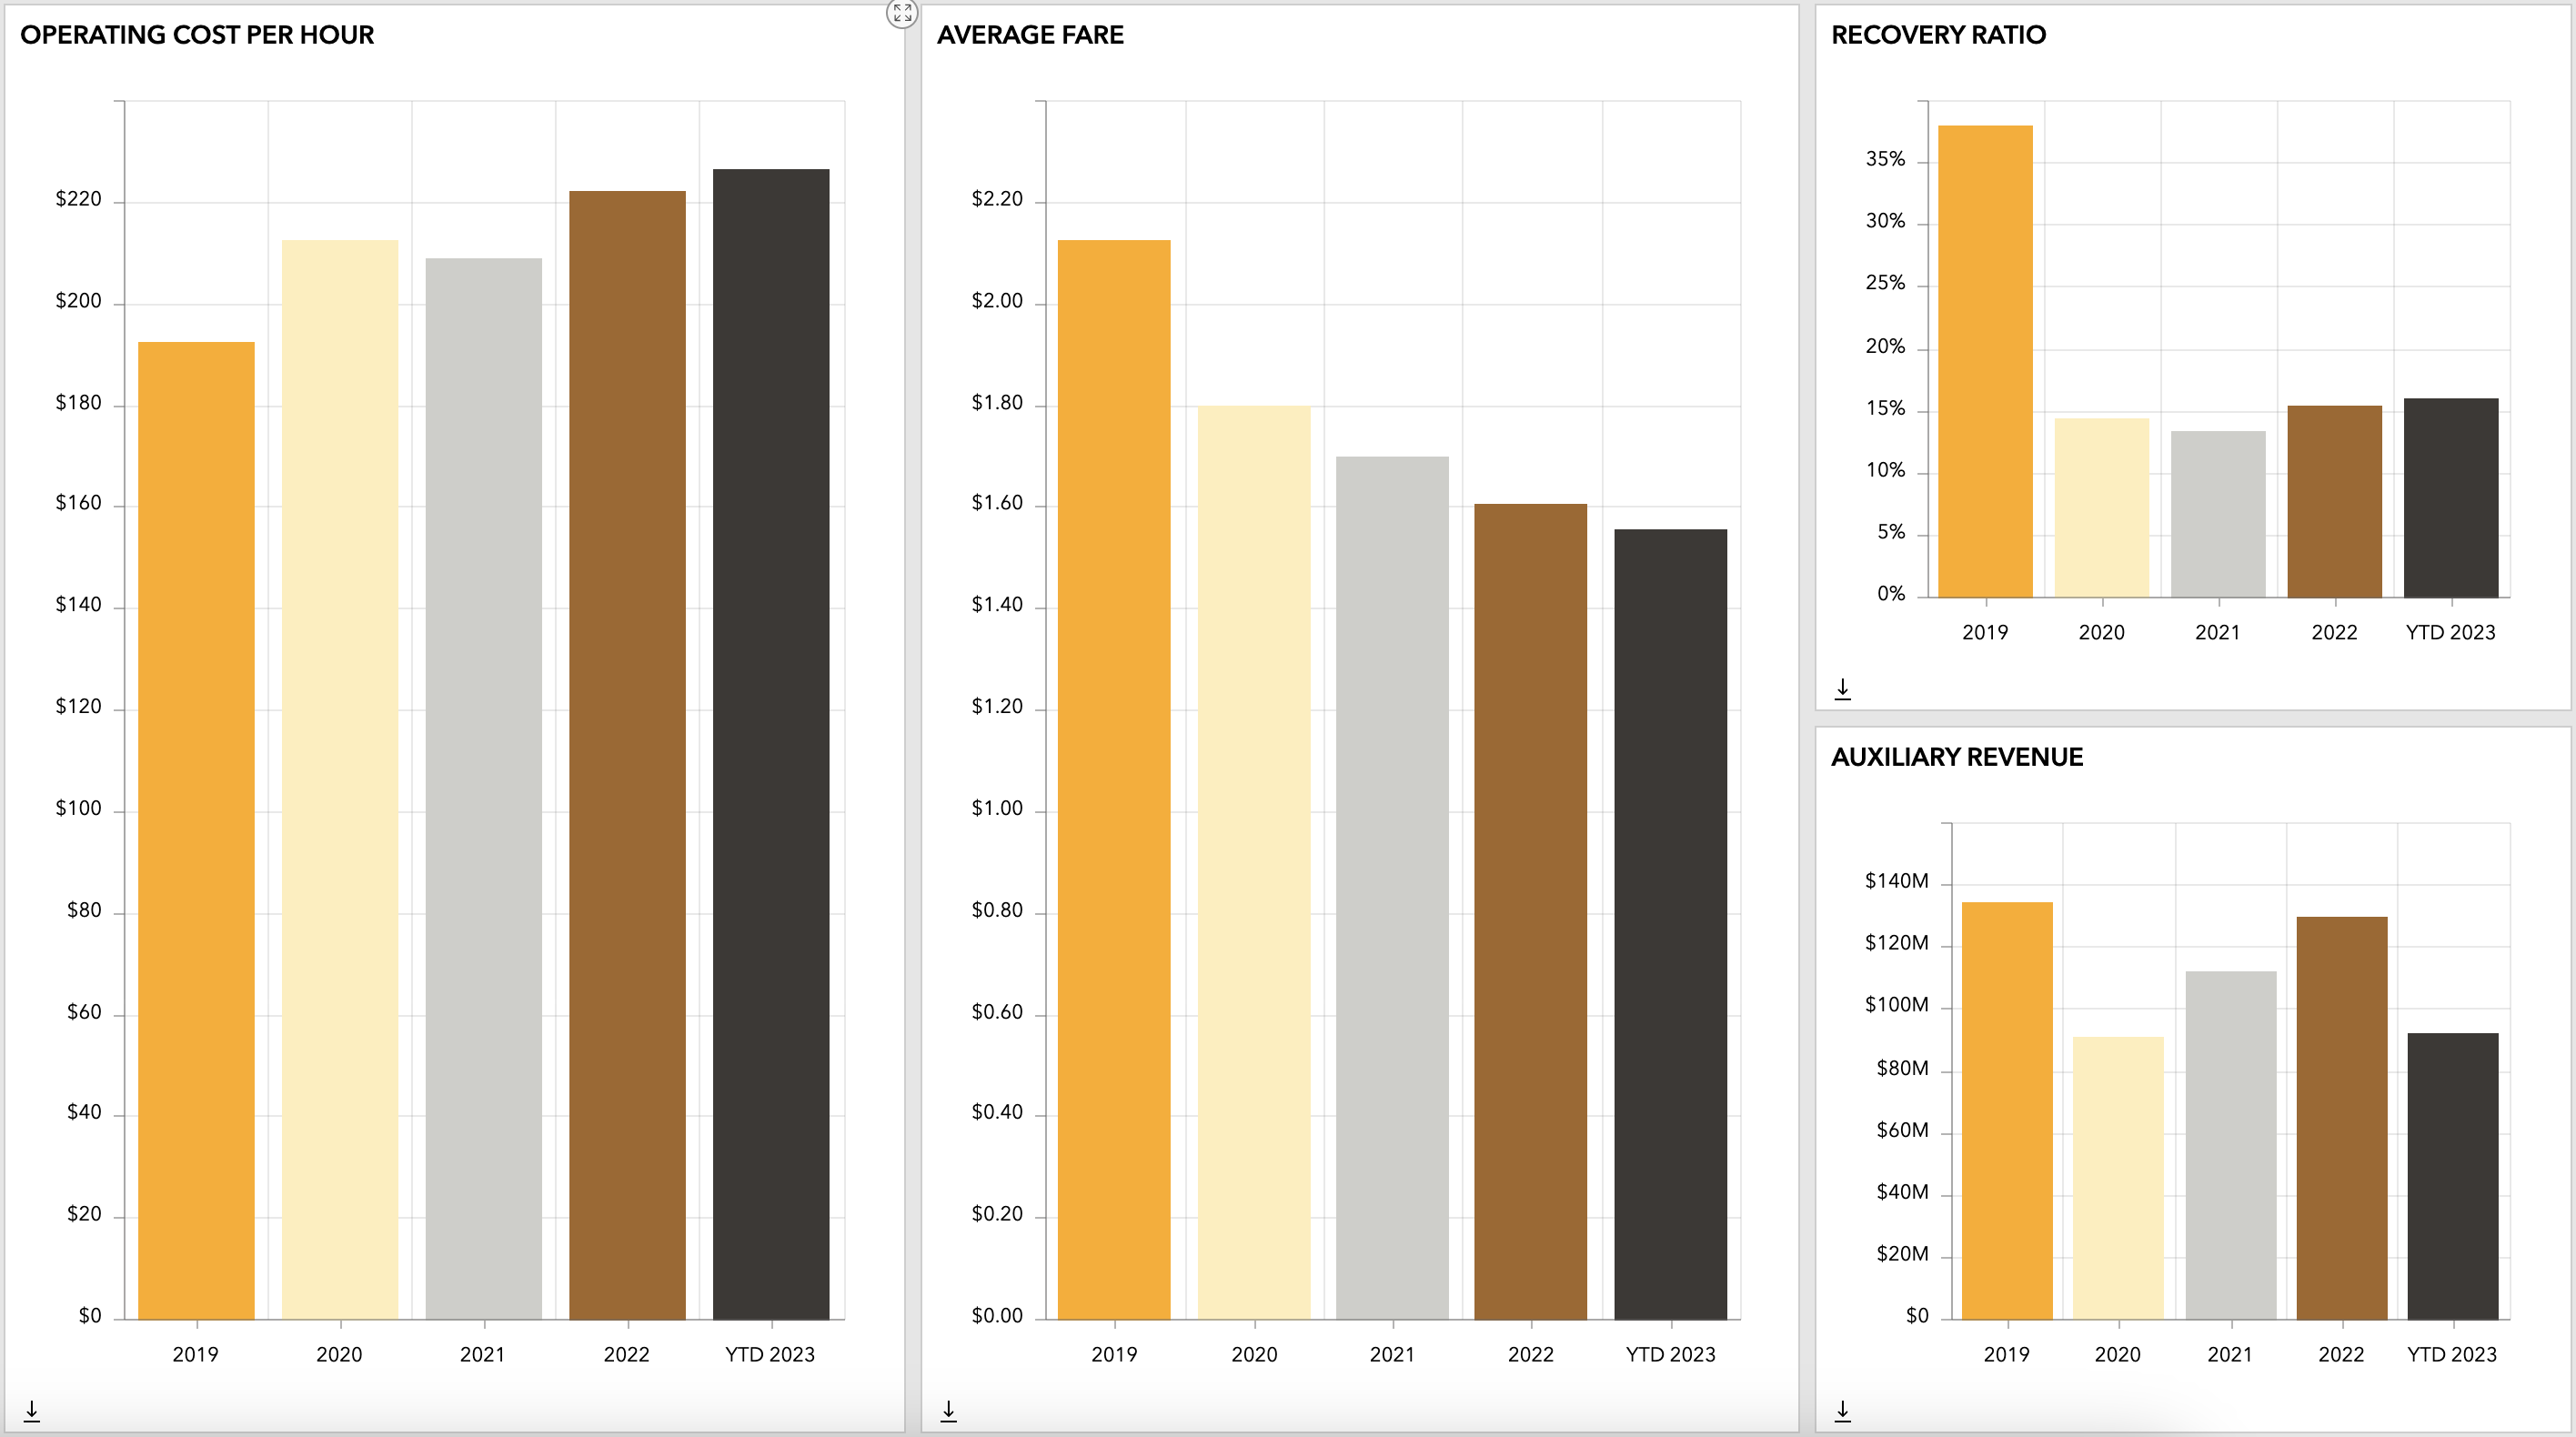
Operating Cost per Hour is the expense associated with the operation of the transit agency, per hour that vehicles travel while in revenue service.
Average Fare includes all income received directly from passengers, paid either in cash or through pre-paid tickets, passes, etc., divided by the total number of passenger trips taken, including reduced and free rides and transfers.
Recovery Ratio is the percentage of the operating cost of transit service that is covered by income received directly from passengers (paid either in cash or through pre-paid tickets, passes, etc.). So far in 2023, the recovery ratio for the system is at its highest post-pandemic level. While this is a good indicator of transit’s recovery, the RTA is advocating for reform to the farebox recovery ratio mandate, which is the strictest in the country.
Auxiliary Revenue results from business-type activities in which an agency earns supplemental revenues, including advertising and concessions.
The metrics on this dashboard reflect to what degree our transit system is safe, accessible, reliable, and useful to our riding public.
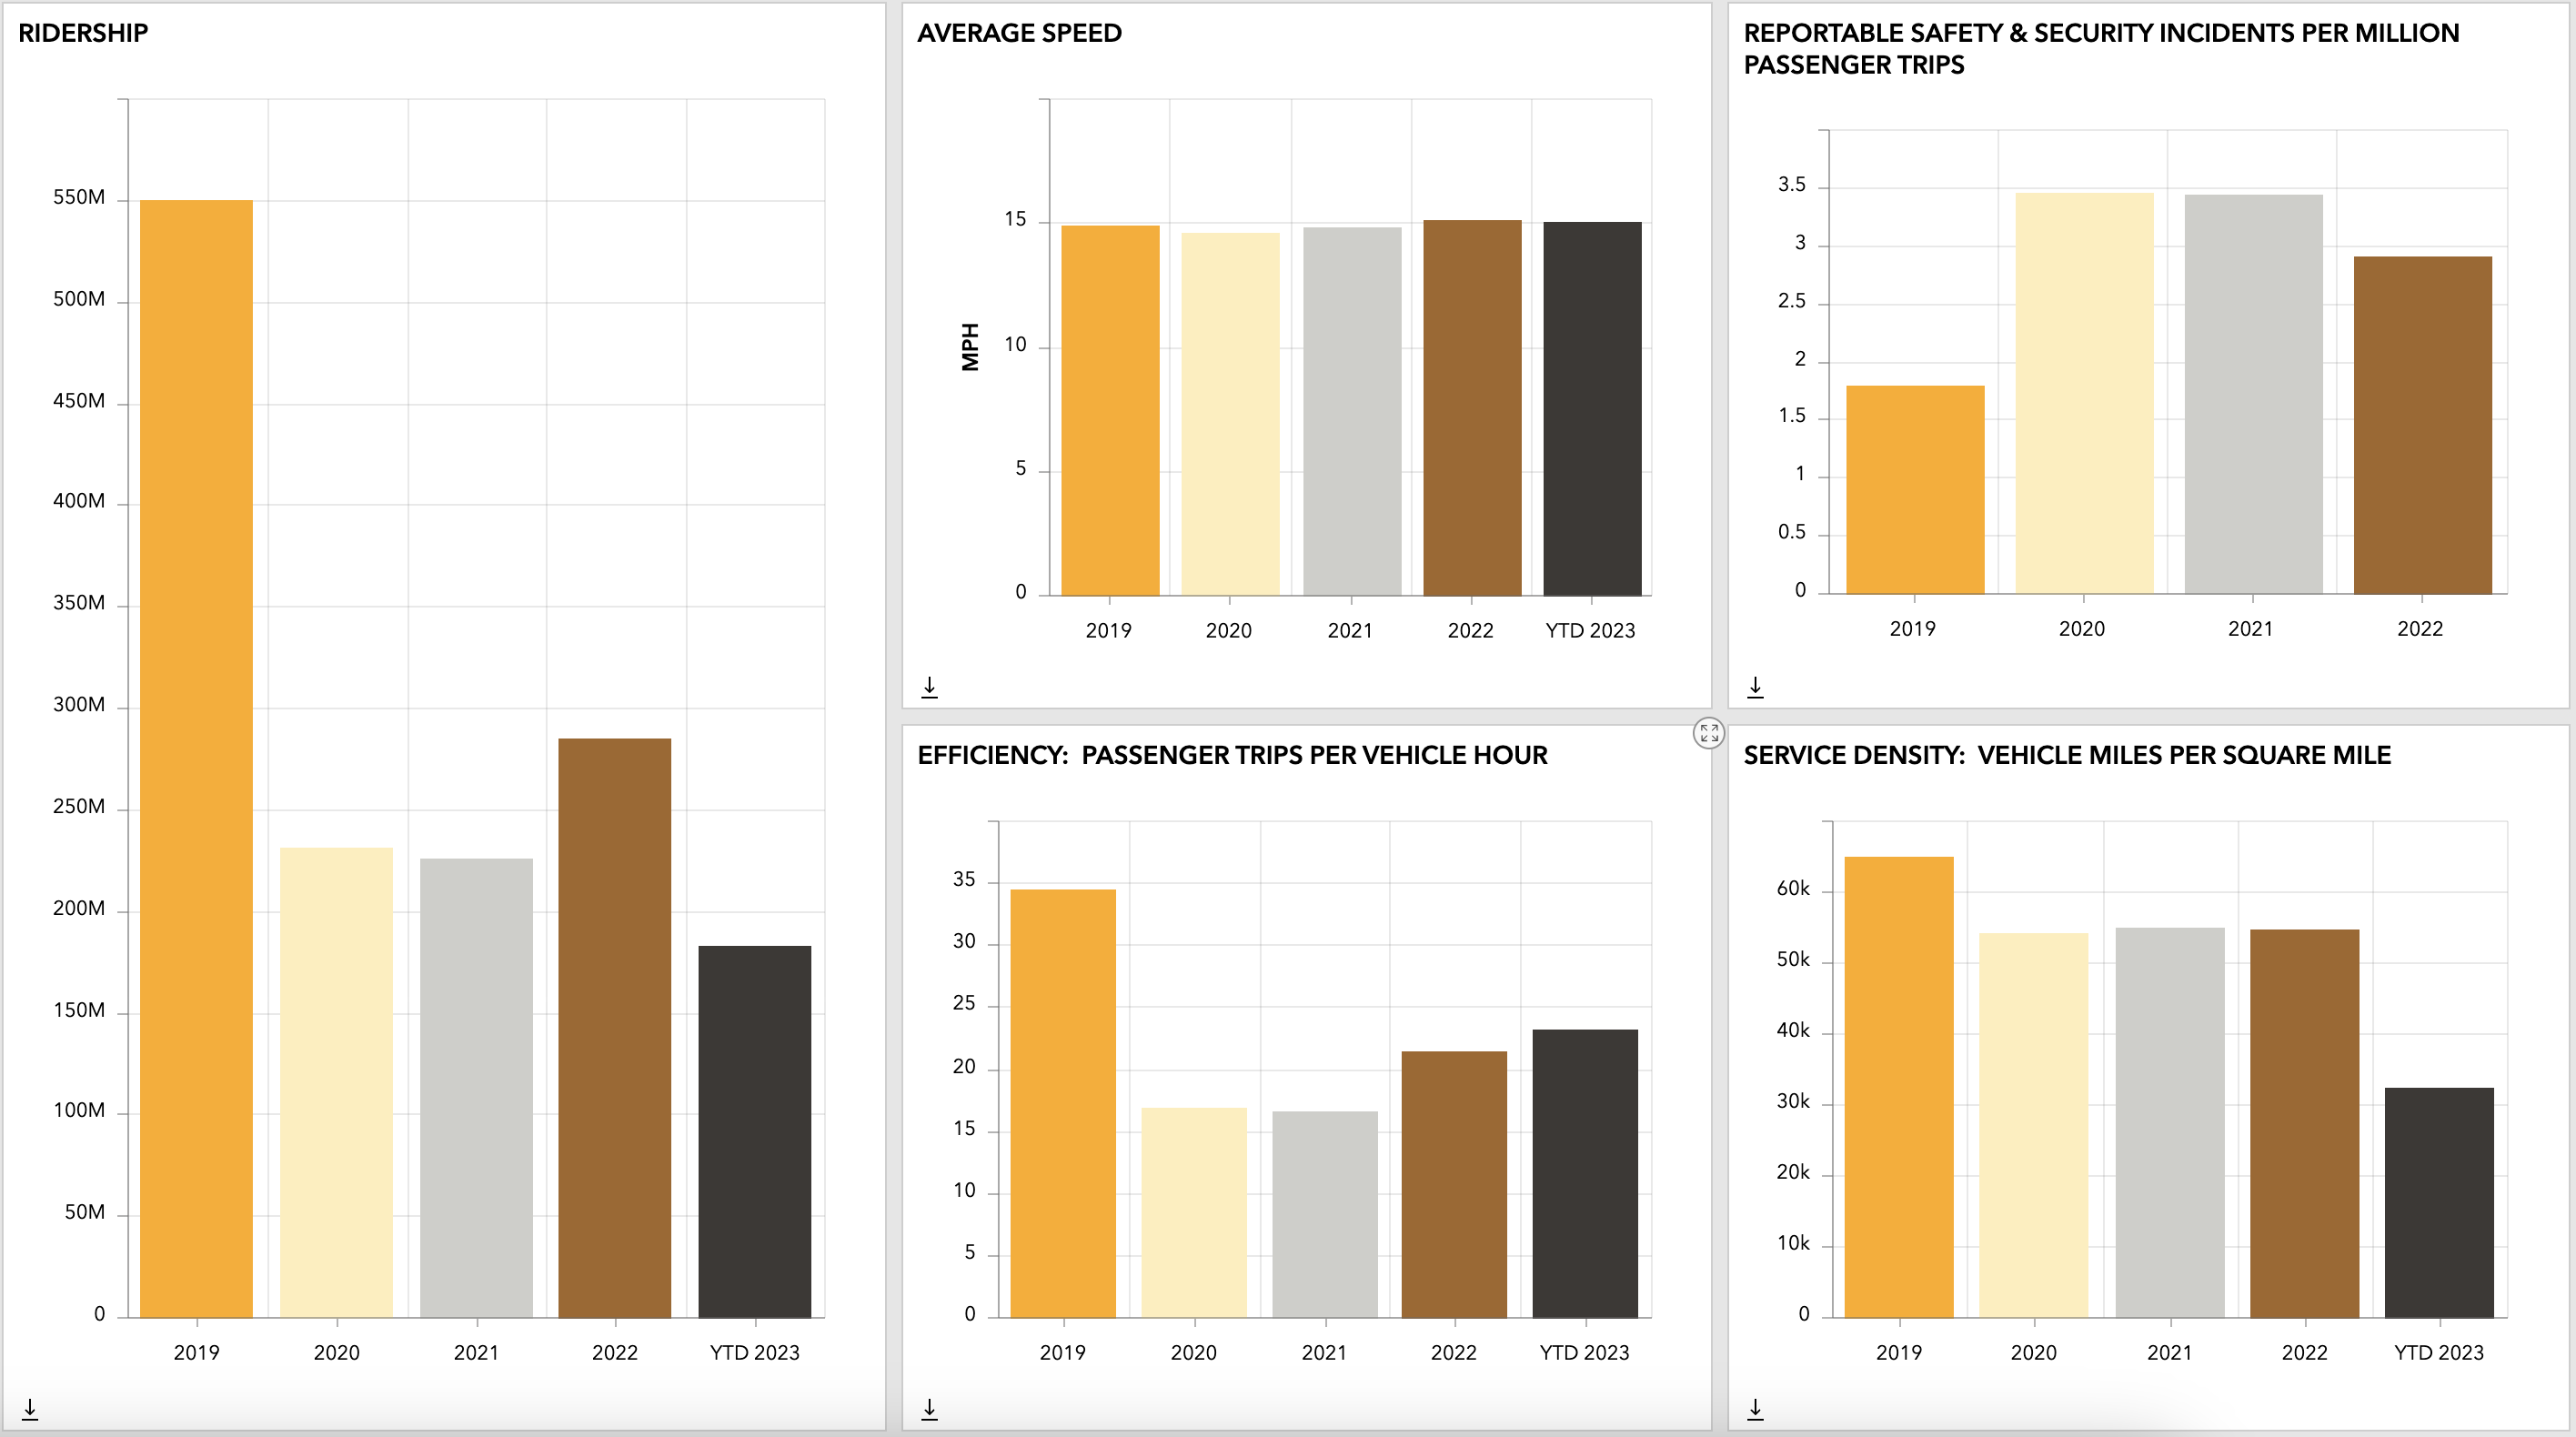
Ridership: total number of trips taken on transit service. So far, ridership for every month of 2023 has exceeded corresponding months’ ridership of 2022. All three Service Boards – the CTA, Metra, and Pace – have hit post-pandemic ridership milestones in recent weeks.
Average Speed is calculated as the total vehicle revenue miles divided by the total vehicle revenue hours.
Efficiency: the number of passenger trips per hour of transit service. The amount of service has increased by 2 percent in 2023 compared to 2022, but ridership is up 17 percent for the same period, indicating improved efficiency.
Reportable Events per Million Passenger Trips includes all safety and security incidents meeting the thresholds established by the Federal Transit Administration and Federal Railroad Administration (for commuter rail), expressed on a per million passenger trip basis.
Service Density: total annual vehicle miles of service per square mile of the transit operator’s service area.
Transit is the answer to many of the region’s challenges but is threatened by lack of sufficient operating and capital funding after years of disinvestment and a pandemic. Our region’s current transit funding structure is also overly reliant on fares. Together this leaves our transit agencies to face an existential crisis that neither fare hikes nor service cuts can solve while preserving a useful and equitable system. We need your help to win sustainable funding for transit and build a better system for everyone who relies on it. The Agenda for Advocacy and Action in this plan lays out a path to position the system for long-term success by seeking new funding, making improvements for riders, and supporting communities working to increase transit access.
We recognize we can’t do this alone. Many of the advocacy and action items in this plan are not under the control of RTA, CTA, Metra, and Pace. Leadership from a diverse group of elected officials, community leaders, and riders is needed to achieve meaningful change. Join the Transit is the Answer Coalition to stay engaged and advocate for our transit system.
View our other dashboards on the State of Transit and Finance.
Subscribe to our Newsletter
Related Articles
 Coalition members provide feedback on ‘Transforming Transit,’ RTA’s vision for improved service and accountability
Nearly 200 riders, advocates, and other stakeholders met virtually with the RTA on February 11 for the sixth quarterly Transit is the Answer Coalition meetin...
February 20, 2025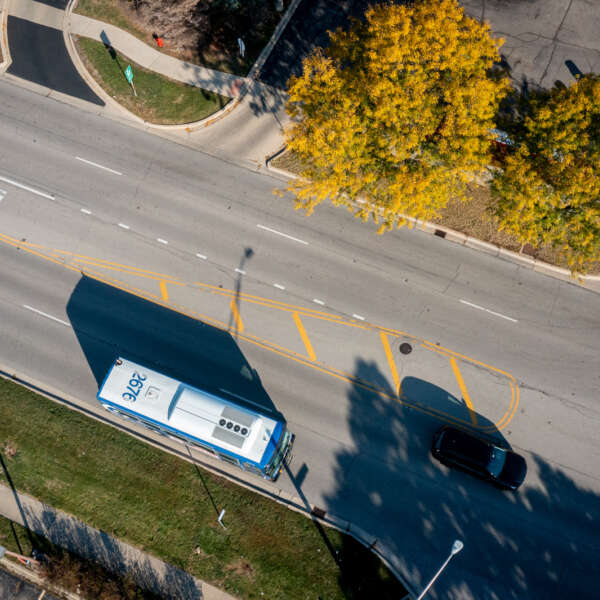 Far South Halsted Corridor Study prepares for future Pace Pulse service
An RTA Community Planning project kicked off in late 2023 as a crucial step in bringing Pace Pulse service to Chicago’s south suburbs. The Far South Halsted ...
February 19, 2025 RTA proposes reforms to prioritize capital projects, maximizing impact of funding
RTA is proposing a historic restructuring of the region’s transit governance to maximize the impact of new operating funding and ensure all riders experience...
February 5, 2025 RTA proposes reforms to integrate fares, require accountability for faster and more reliable transit
RTA is proposing a historic restructuring of the region’s transit governance to maximize the impact of any new operating funding and ensure all riders experi...
February 5, 2025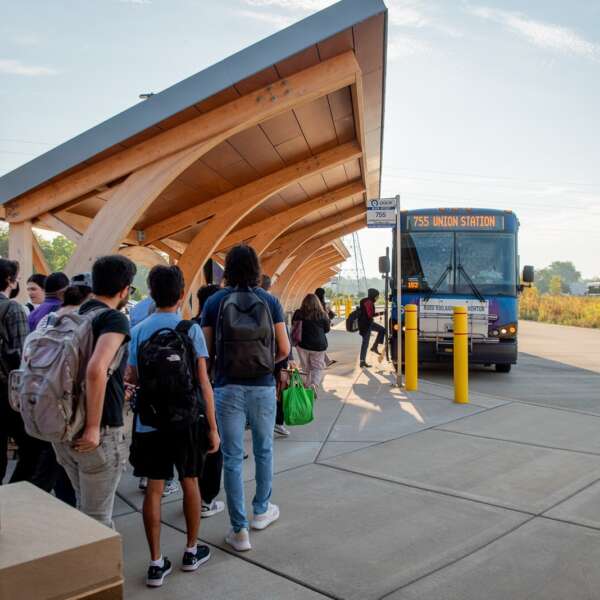 For the third year in a row, regional transit ridership was up by double-digits in 2024
Ridership across the Chicago region’s transit system continued to increase throughout 2024, according to the latest data from CTA, Metra, and Pace. The regio...
January 28, 2025 RTA is seeking $1.5 billion in annual operating funding. What would that mean for your commute?
On January 15, RTA released Transforming Transit, a vision for the regional transit system with $1.5 billion in annual operating funding supported by a stron...
January 28, 2025