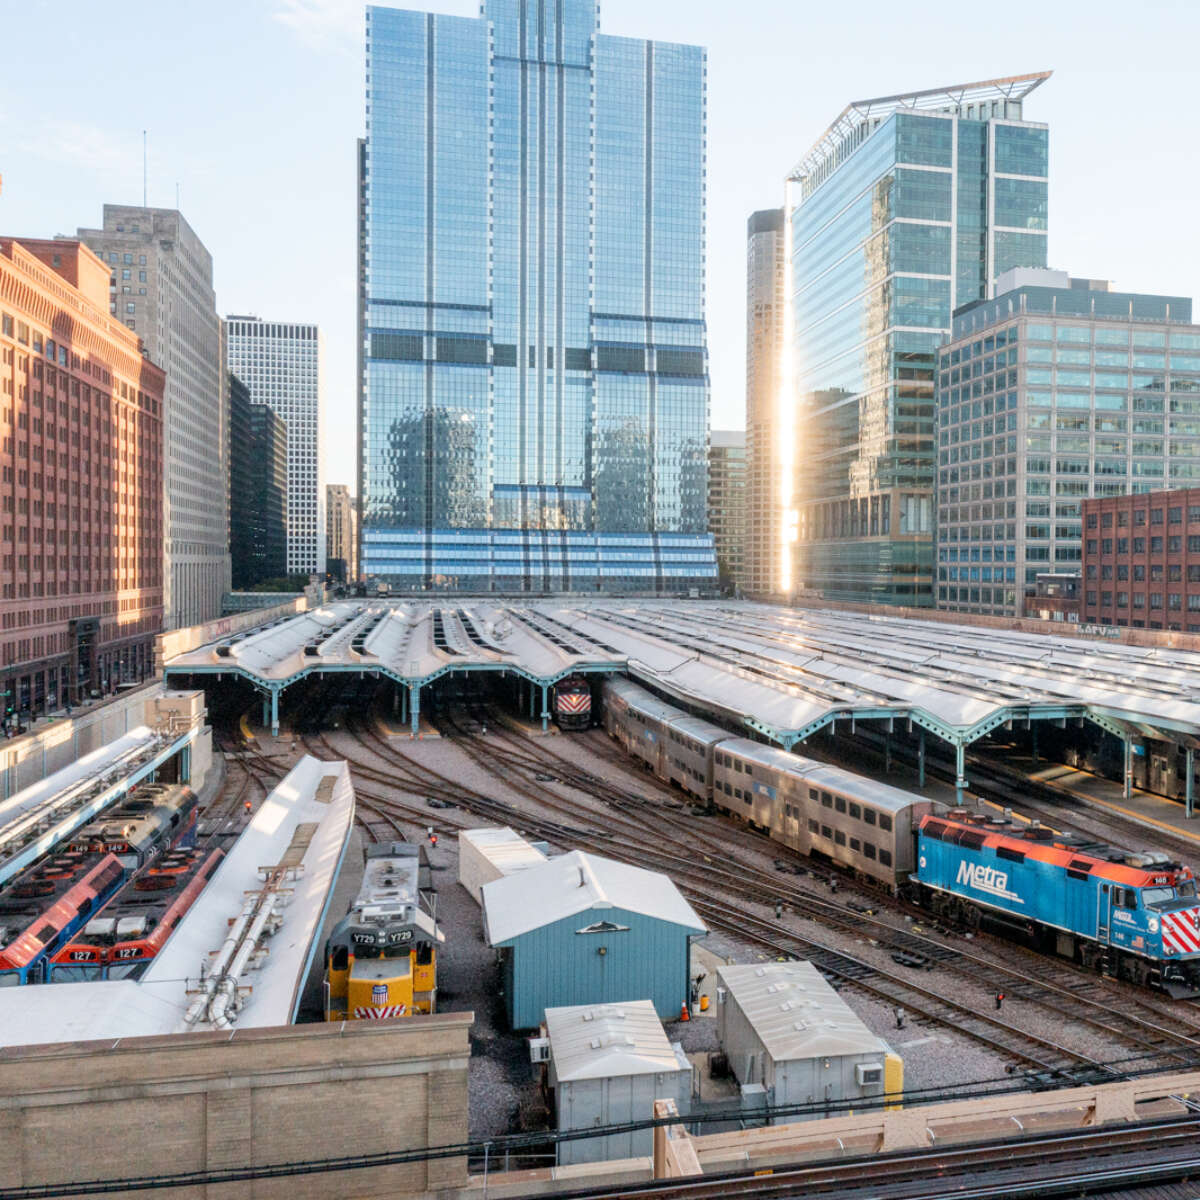
The current capital program is available in the Adopted 2024 Operating Budget, Two-Year Financial Plan, and Five-Year Capital Program and in an interactive format on the RTA’s Mapping and Statistics website (RTAMS) on the Regional Capital Program page. The proposed 2024-2028 five-year capital program totals $5.975 billion.
The Service Boards are working to bring the system up to a state of good repair while also advancing regional priorities including: providing a more equitable transit system, achieving full accessibility, and transitioning to sustainable forms of transit.
- CTA’s five-year capital program has $3.615 billion programmed for capital expenditures and debt service. CTA’s equity projects include the Red Line Extension to 130th Street and the Bus Slow Zone elimination program. CTA’s accessibility projects include several stations that will become accessible that are funded in the All Stations Accessibility Program. CTA-funded sustainable transit projects include the purchase of electric buses and electrification of bus garages.
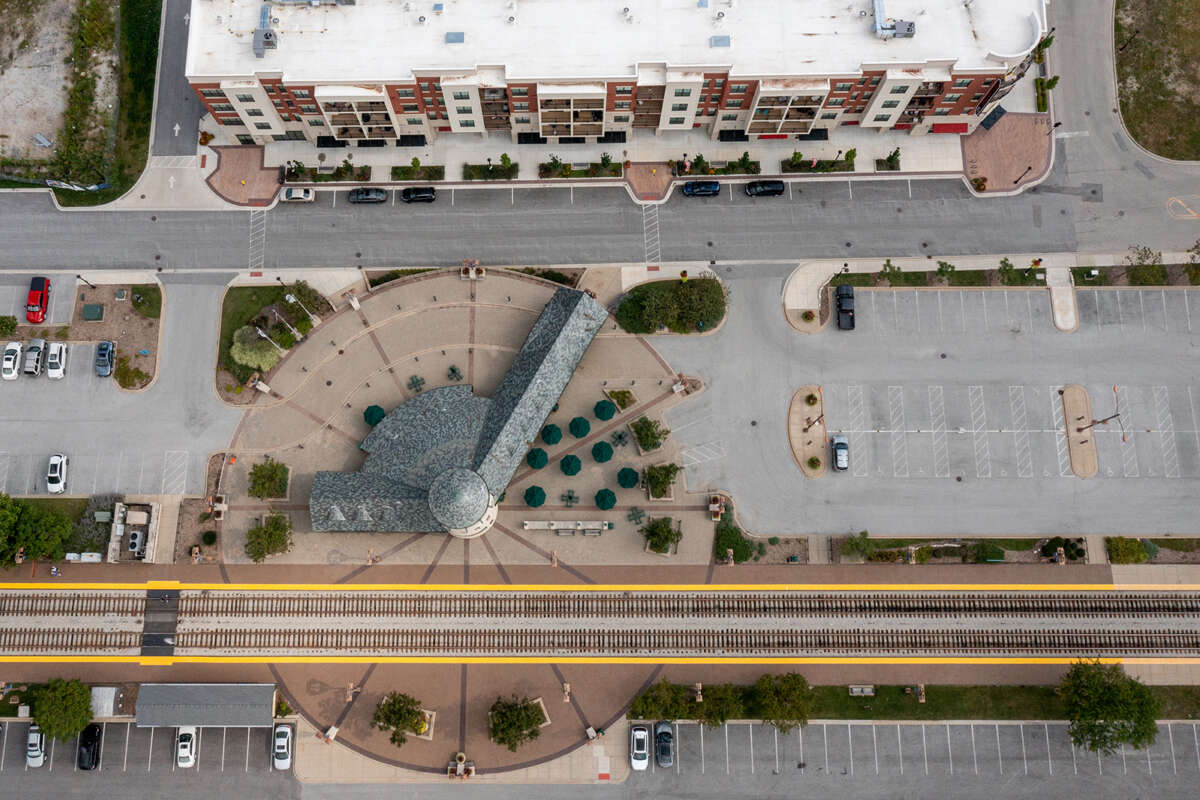
- Metra’s five-year capital program has $1.947 billion available. Metra’s equity projects include the Auburn Park Station and Harvey Transportation Center. Metra’s accessibility projects include station ADA rehabilitations. Metra’s sustainable transit projects include the purchase of zero-emission locomotives and trainsets.
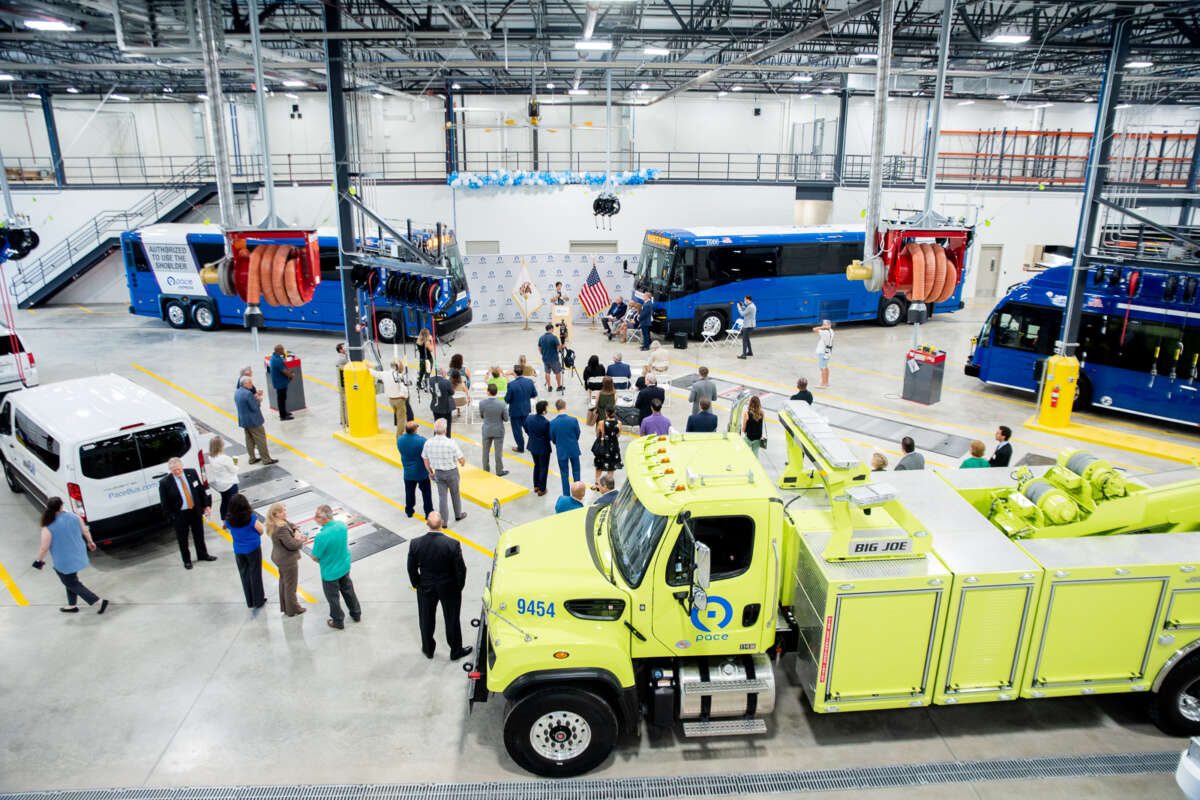
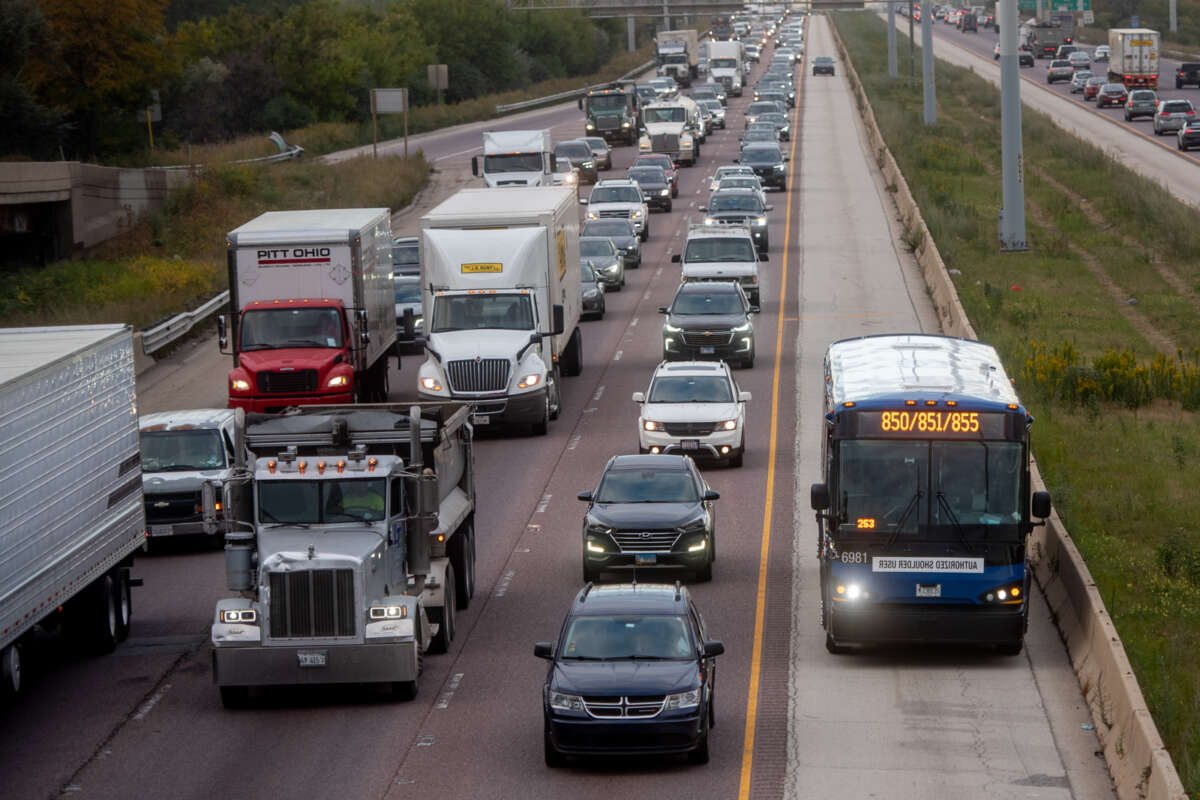
- Pace’s five-year capital program is $413 million. Pace’s equity projects include Pulse Network expansion along two corridors: 95th Street and Halsted Street. Pace’s accessibility projects include the purchase of new Paratransit vehicles. Pace’s sustainable transit projects include the purchase of electric buses and the electrification and expansion of three bus garages: North, River, and Southwest Divisions.
The new performance‐based capital allocation process is used for federal formula and PAYGO funding, starting in 2025 and moving forward. Funds are distributed based on three principles:
- Addressing capital reinvestment need
- Incentivizing faster completion of projects
- Advancing regional policy priorities
The 2024-2028 Capital Program has been evaluated using 15 metrics that were identified in Transit is the Answer. The evaluation metrics for each project can be found in the 2024 Adopted Regional Transit Budget Capital Program Appendix. The evaluations for all projects in the 2024-2028 Capital Program are also available on the RTAMS Capital Program website with search functionality and a downloadable dataset.
2025-2029 Capital Program
The 2025-2029 Capital Program is developed throughout 2024. The RTA encourages public engagement. Key activities are:
- May 16: Five Year Capital Program Call released by the RTA Board
- Early June: Preliminary federal funding estimates for the region are released
2025-2029 FEDERAL FORMULA FUNDING ESTIMATES*
In accordance with public participation requirements for 49 USC §5307 (A)(1) federally funded program of projects, below are the preliminary federal formula funding appropriation estimates* per Service Board for calendar years 2025-2029
| | 2025 | 2026 | 2027 | 2028 | 2029 | Total |
|---|
| CTA | | | | | | | |
| 5307/5340 | $173,275,536 | $175,008,292 | $177,799,637 | $179,577,634 | $181,373,410 | $887,034,509 |
| 5337 | $254,953,917 | $257,503,457 | $258,958,670 | $261,548.257 | $264,163,739 | $1,297,128,040 |
| 5339 | $12,860,801 | $12,989,409 | $13,197,862 | $13,329,840 | $13,463,139 | $65,841,051 |
| Total | | $441,090,254 | $445,501,158 | $449,956,169 | $454,455,731 | $459,000,288 | $2,250,003,600 |
| | | | | | | |
| Metra | 5307/5340 | $102,265,860 | $103,288,519 | $106,216,364 | $107,278,528 | $10108,351,313 | $527,400,584 |
| 5337 | $140,075,184 | $141,475,936 | $144,010,517 | $145,450,622 | $146,905,128 | $717,917,387 |
| Total | | $242,341,044 | $244,764,455 | $250,226,881 | $252,729,150 | $255,256,441 | $1,245,317,971 |
| | | | | | | |
| Pace | | | | | | | |
| 5307/5340 | $53,797,670 | $54,355,647 | $51,942,780 | $52,464,208 | $52,986,830 | $265,525,135 |
| 5339 | $1,615,678 | $1,631,835 | $1,569,595 | $1,585,291 | $1,601,144 | $8,000,543 |
| Total | | $55,413,348 | $55,967,482 | $53,512,375 | $54,047,499 | $54,587,974 | $273,528,678 |
| | | | | | | |
| System | | $738,844,646 | $746,233,095 | $753,695.425 | $761,232,380 | $768,844,703 | $3,768,850,249 |
*Funding estimates may be equal or less than what is stated above
- Early August: Preliminary capital funding estimates by Service Board are released
2025 - 2029 Preliminary Capital Funding Estimates
| CTA | |
2025 |
2026 |
2027 |
2028 |
2029 |
Total |
| Federal |
$447,590,254 |
$536,256,490 |
$539,563,984 |
$505,955,731 |
$465,500,288 |
$2,494,866,747 |
| State |
$161,190,000 |
$161,190,000 |
$161,190,000 |
$161,190,000 |
$161,190,000 |
$805,950,000 |
| Local |
$7,967,000 |
$8,222,000 |
$8,469,000 |
$8,689,000 |
$8,915,000 |
$42,262,000 |
| CTA Total |
|
$616,747,254 |
$705,668,490 |
$709,222,984 |
$675,834,731 |
$635,605,288 |
$3,343,078,747 |
| |
|
|
|
|
|
|
| Metra |
|
2025 |
2026 |
2027 |
2028 |
2029 |
Total |
| Federal |
$ 271,365,181 |
$244,764,455 |
$ 350,226,881 |
$322,049,150 |
$ 255,256,441 |
$1,443,662,108 |
| State |
$ 88,560,000 |
$ 88,560,000 |
$ 89,640,000 |
$ 89,640,000 |
$ 89,640,000 |
$446,040,000 |
| Local |
$ 6,473,000 |
$ 6,680,000 |
$ 6,853,000 |
$ - |
$ - |
$20,006,000 |
| Metra Total |
|
$ 366,398,181 |
$340,004,455 |
$ 446,719,881 |
$ 411,689,150 |
$344,896,441 |
$1,909,708,108 |
| |
|
|
|
|
|
|
| Pace |
|
2025 |
2026 |
2027 |
2028 |
2029 |
Total |
| Federal |
$ 55,413,348 |
$ 55,967,482 |
$ 53,512,375 |
$ 54,047,499 |
$ 54,587,974 |
$ 273,528,678 |
| State |
$ 20,250,000 |
$ 20,250,000 |
$ 19,170,000 |
$ 19,170,000 |
$ 19,170,000 |
$ 98,010,000 |
| Local |
$ 3,157,765 |
$ 2,226,820 |
$ 2,293,624 |
$ - |
$ - |
$ 7,678,209 |
| Pace Total |
|
$ 78,821,113 |
$ 78,444,302 |
$ 74,975,999 |
$ 73,217,499 |
$ 73,757,974 |
$ 379,216,887 |
| |
|
|
|
|
|
|
| System Total |
|
$1,061,966,548 |
$1,124,117,247 |
$1,230,918,864 |
$1,160,741,380 |
$1,054,259,703 |
$5,632,003,742 |
- September 12: RTA Board reviews capital funding amounts for adoption
- October/November: Service Boards hold public hearings on their Proposed Five-Year Capital Programs
- By November 15: CTA, Metra, and Pace boards review and adopt Five Year Capital Programs to submit to the RTA
- November 22: Service Boards present their Five-Year Capital Programs to the RTA Board
- November/December: RTA holds public hearings on the regional proposed Five-Year Capital Program
- December 19: RTA Board reviews regional Five-Year Capital Program for adoption

